There comes a time in an application’s life when running all the tests in series takes too long. Who wants to wait an hour (or even multiple hours) just to find out that the tests for your code changes have failed? Engineers certainly don’t!
Upon crossing this “tests are taking too long” threshold, the first and most obvious approach to reducing test suite run time is to parallelize the work. Test splitting is the process of dividing the test suite across multiple workers, with each worker running a subset of the test examples in the suite. While the concept seems straightforward, implementing test splitting requires careful consideration of test isolation, timing consistency, and resource allocation.
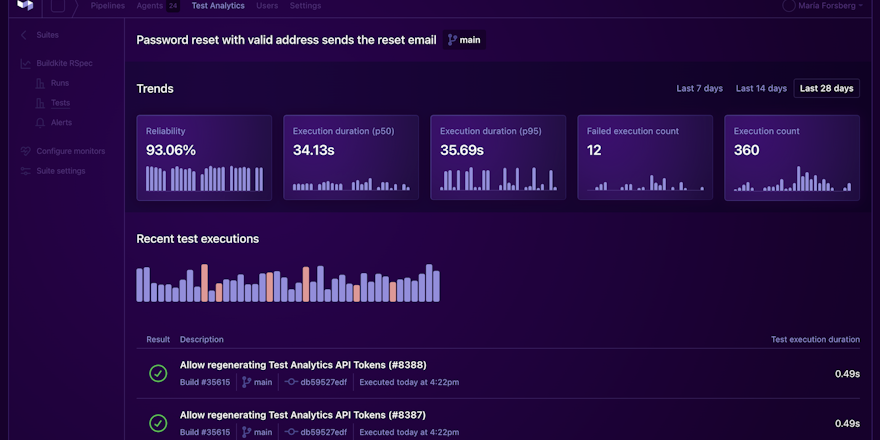
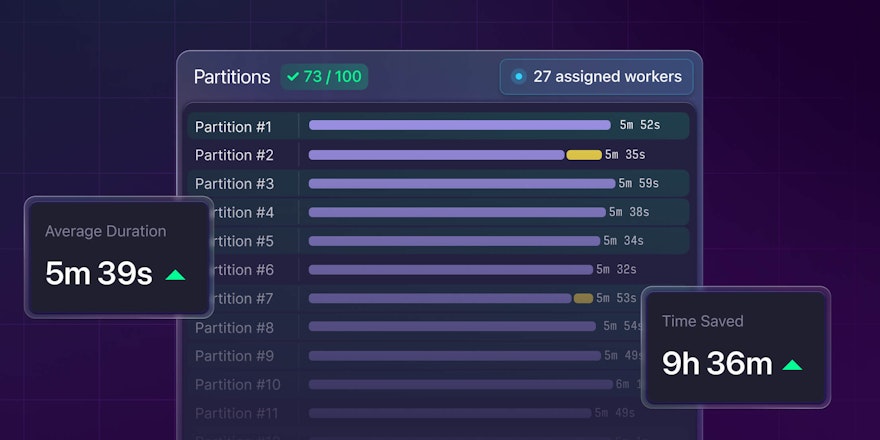
Buildkite’s recently released Test Engine Client (bktec) tackles these challenges head-on, allowing organizations to effortlessly parallelize their test suites and reduce the time spent waiting for CI builds to pass. The Test Engine Client is deeply integrated with Buildkite Test Engine, utilizing timing data collected by our test collector packages to ensure that all parallel workers perform the same amount of work and complete in the same amount of time.
In this post, we’ll explore the fundamentals of test splitting, examine the technical challenges in partitioning test suites effectively, and discuss how factors like flaky tests can impact your parallelization strategy.
Understanding test suite parallelization
While parallelizing test suites might seem like a straightforward solution to long build times, the relationship between worker count and execution speed isn’t linear. As the number of parallel workers increases, the added benefit of each extra worker decreases. For each run of the suite, we must pay the overhead costs associated with preparing our tests to be run, whether that's starting up a Docker container or seeding a database and tearing things down once the tests are finished. These costs must be paid by each worker that does any work, and so the best case scenario is that our newly parallelized test suite takes as long as the overhead time to run, and no faster. It’s also important to note that we approach this limit quickly as we scale up from 1, and rapidly run into marginal gains as the parallelism is increased further.
The time taken to run the full test suite is defined as the number of tests per worker multiplied by the average time per test, plus the overhead time. The figure below illustrates the hyperbolic nature of this function, for a test suite of 1000 tests that take an average of 1s to run, and an overhead time of 60s per worker. As the number of workers scales from 1 to 10, the time taken for a full run drops drastically, but after that this run time quickly approaches the 60s asymptote.
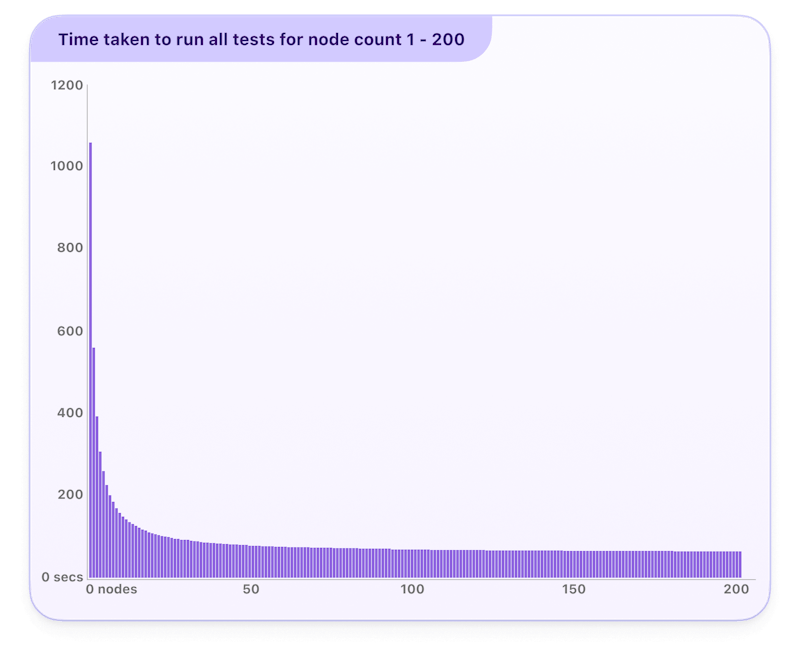
Time taken to run all tests for node count 1 - 200
Buildkite’s approach to test distribution
The key to effective test parallelization lies in intelligent work distribution. To achieve this, Buildkite Test Engine uses historic test timing data to accurately predict how long an individual test will take to run in the future. This timing data is used as input to a bin packing algorithm that distributes the work of running all of the tests across the number of parallel workers defined in the pipeline configuration. The algorithm is optimized to ensure that all parallel workers finish in the same amount of time.
Buildkite will suggest a worker parallelism count such that all workers complete their tests within 2 minutes, not including the overhead costs. This parallelism count is just a suggestion though, and you can set the count to as many workers as you like. However, you should be wary of the diminishing returns outlined in the previous section.
Given a sufficiently large test suite, it’s reasonably easy to generate a file-level split with consistent estimated timings across all workers. However, when these tests are actually run on the workers, the actual timing results will differ due to random differences in test run time and retrying any failed tests. The evenness of the actual results is therefore dependent on the accuracy relative to the estimate, which can be influenced mainly through two factors:
- Execution time: Each time a single test is run, an execution timing data point is generated. This data is aggregated at the file level to generate timing data on a per-file basis. When considering which bin to pack a test file into, we must first estimate the time that we think the file will execute in. There are a number of data points that could be picked: mean, median, or p90, to name a few.
- Execution count: As test files are likely to change over time, we must pick a number of samples to estimate the timing data from. Too many samples, and we may underestimate how long a file will take if that file has recently been changed, whereas too few samples may not give us an accurate representation of the actual time.
By carefully configuring these two settings, Buildkite accurately predicts how long a test file will take to execute, generating even time splits across your parallel workers.
Optimizing split strategies: files vs. examples
The length of time taken to execute a complete test file can vary wildly depending on the nature of the tests contained within. Unit tests tend to be large in number but quick to run individually, while integration tests tend to be fewer in number but take significantly longer. Given a comprehensive test suite has a mixture of test types, it is reasonable to assume that some individual test files will exceed the 2-minute threshold for parallelism outlined above.
This presents some issues when trying to bin pack these test files, as we can never generate an even split if there are too many slow test files. One solution for this is to generate a test plan that divides the work by the individual tests rather than only the test files, mitigating uneven test plans at the expense of more effort to divide up the work. This approach is called split by example, as opposed to split by file.
However, there is little reason to split up the entire test suite into individual examples to be distributed, as there is an overhead introduced to run each test individually, rather than via the entire file. Many testing frameworks have a startup cost of loading the file and locating the test in question, and it’s only worth paying this multiple times if the tests in question are significantly slower than this startup cost. For a file containing many fast tests, it wouldn’t be worth the added overhead of splitting them up, so it makes sense to only split the slowest test files to get to the examples within and add them to the distribution set.
We must therefore determine what a slow test file actually is, and there are two approaches: by absolute time, where an arbitrary value of time is used to determine whether a file is slow and should be split, and by percentage, where the top-N percent of slowest files are split.
The Test Engine Client first determines the optimal worker duration, which is equal to the total estimated run time divided by the parallelism, i.e., all workers are equal. Then, any individual files that account for more than 70% of a single worker’s time are marked to be split. This gives a good balance between not splitting unnecessarily while still yielding good evenness of the resulting split.
Handling new tests
There are situations when we do not have timing data for a particular test, such as when the test is a new one in an existing file, or in a completely new file altogether. In these situations, the timing data must be estimated to ensure an even split. This estimated value would only be used once, at which point there would be historical timing data to use instead.
One approach would be to use a fixed time estimate that is constant for all files and examples across the suite. This could be set to the average test time or average file time, depending on whether the suite is being split by file or by example. A more complex approach could be used if the variance in timings is large. Timing data could be estimated based on the test’s context: the average time of other tests in the file, or other files in the directory for split by file.
Drawing from these approaches, the Test Engine Client uses a pragmatic solution: it estimates all tests to take the same amount of time (1000ms) when there is no timing data for the entire suite. If there are existing tests with known timing data, the median of the known timings is used as the estimate.
The impact of flaky tests
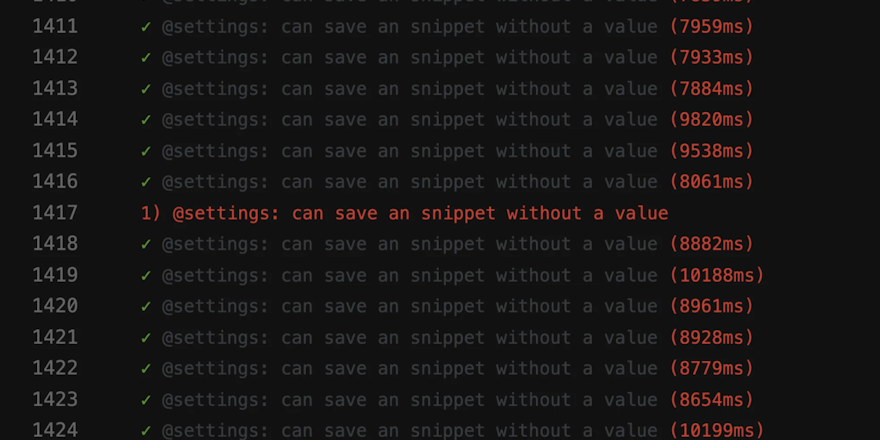
Flaky tests can often negate the speed performance gained by parallelizing a test suite, as the build or the job will need to be re-run until the flaky test passes. There are a couple of factors that affect the amount of damage a flaky test in your test suite can do:
- Flaky proportion: By definition, a flaky test is one that sometimes passes and sometimes fails, for varying definitions of sometimes. We can ascribe a percentage figure to each test to document how often the test fails compared to the total number of times the test is run. A flaky test that fails 80% of the time is going to have a larger impact than a flaky test that fails 20% of the time.
- Flaky timing: Flaky tests often fail at the same point consistently in their run. The time taken to flake is important, especially when flakes are being retried, as a test that is flaky 50% of the time but takes 100 seconds to fail is significantly more impactful than the same test that takes 1 second to fail.
To mitigate these impacts, the Test Engine Client provides two features:
- Internally retry failing tests: The client will collect any failures from the initial run and retry these tests individually in the same job, and retry failing tests up to the number of retries specified in the configuration or until all tests have passed.
- Mute flaky tests: The client integrates with your Buildkite Test Engine data to ignore any failing test results from tests that have been marked with mute. This means you’ll still get results from the test, but its flakiness won’t affect the test run.
Getting started with test splitting on Buildkite
The Test Engine Client is available in our open-source repository and currently supports RSpec, Jest, Playwright, and Cypress test frameworks. We're planning to add more frameworks—let us know which ones you’d like to see next.
The Test Engine Client enables Buildkite Test Engine’s test splitting feature, which is available on all Buildkite Pro and Enterprise plans. Current Buildkite customers can check plans or upgrade through their organization’s in-app billing settings.
New to Buildkite? Schedule a demo with one of our software delivery experts or start exploring today with a free 30-day trial.

